Bozeman, MT Exercise Physiology Lab, Bike Fitting & Coaching
Test. Train. Perform.
Lab-grade VO₂max and lactate threshold testing, professional bike fitting, and personalized endurance coaching — led by exercise physiologist Tom Cuddy, M.Sc.
Services
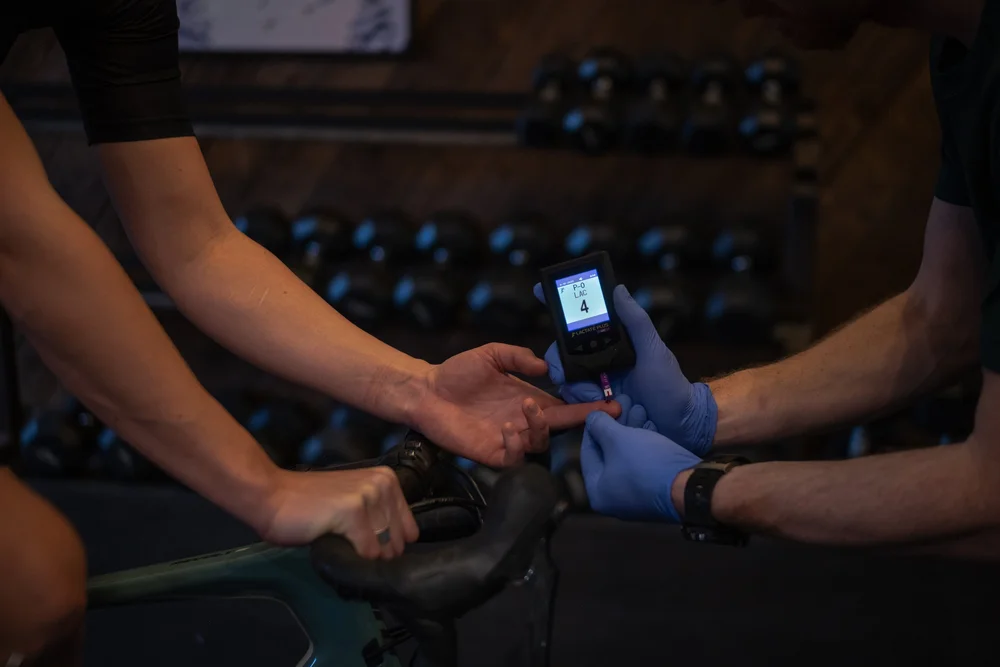
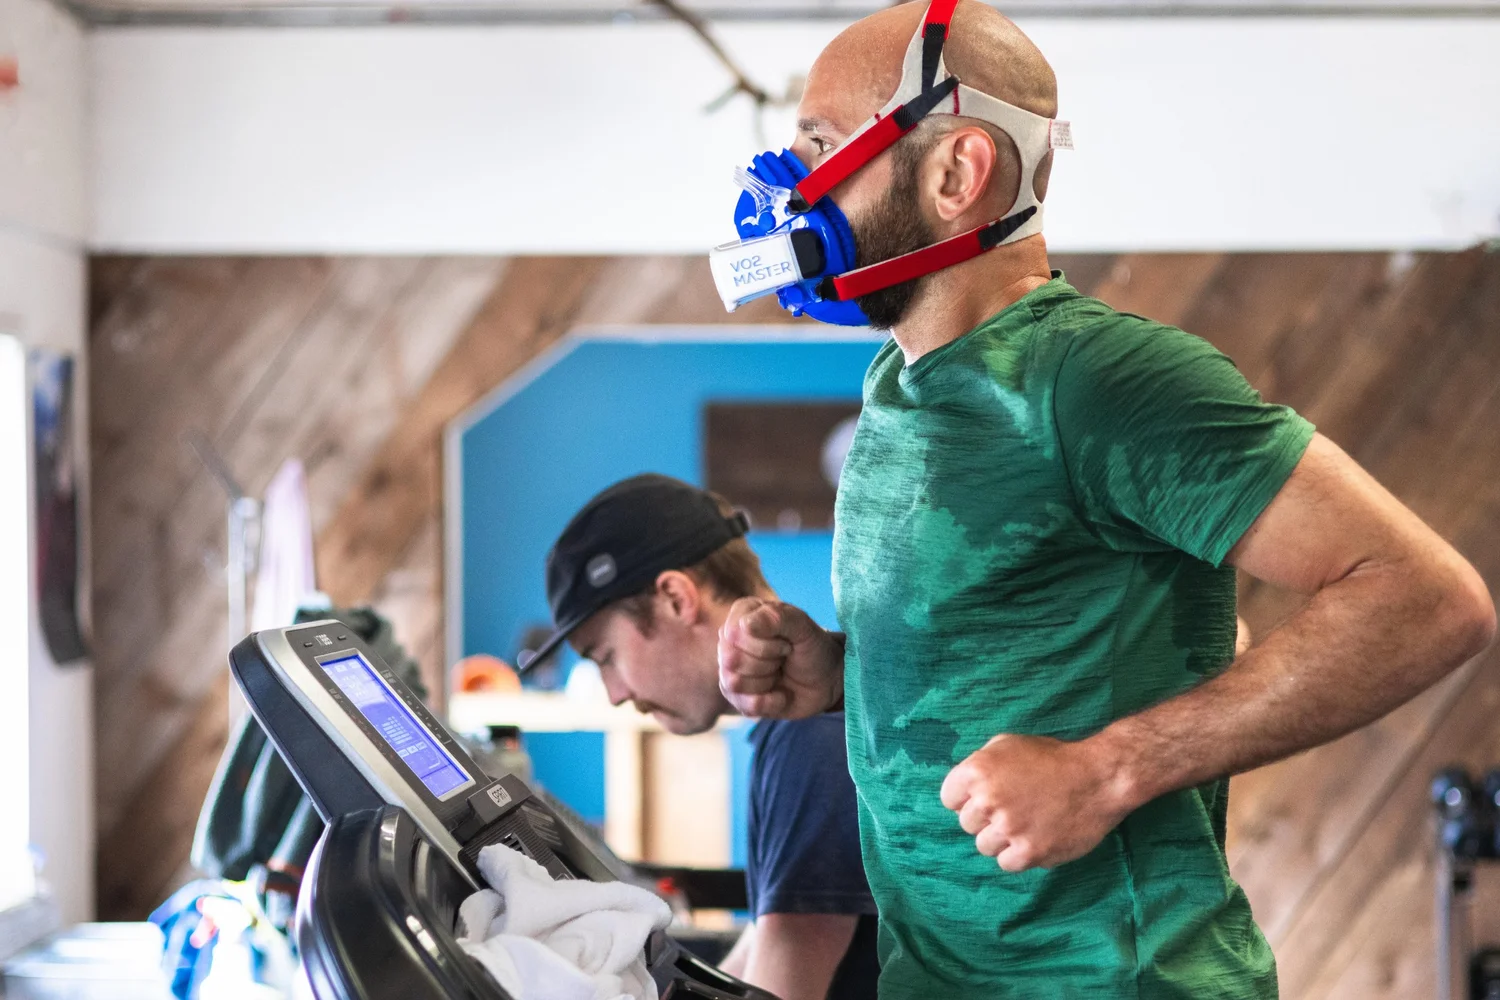
Metabolic Performance Testing
Take a scientific approach to your training by measuring your VO₂max, lactate thresholds, VLamax, and exercise economy. Turn the results into actionable information by understanding your physiologic profile and training intensity zones.
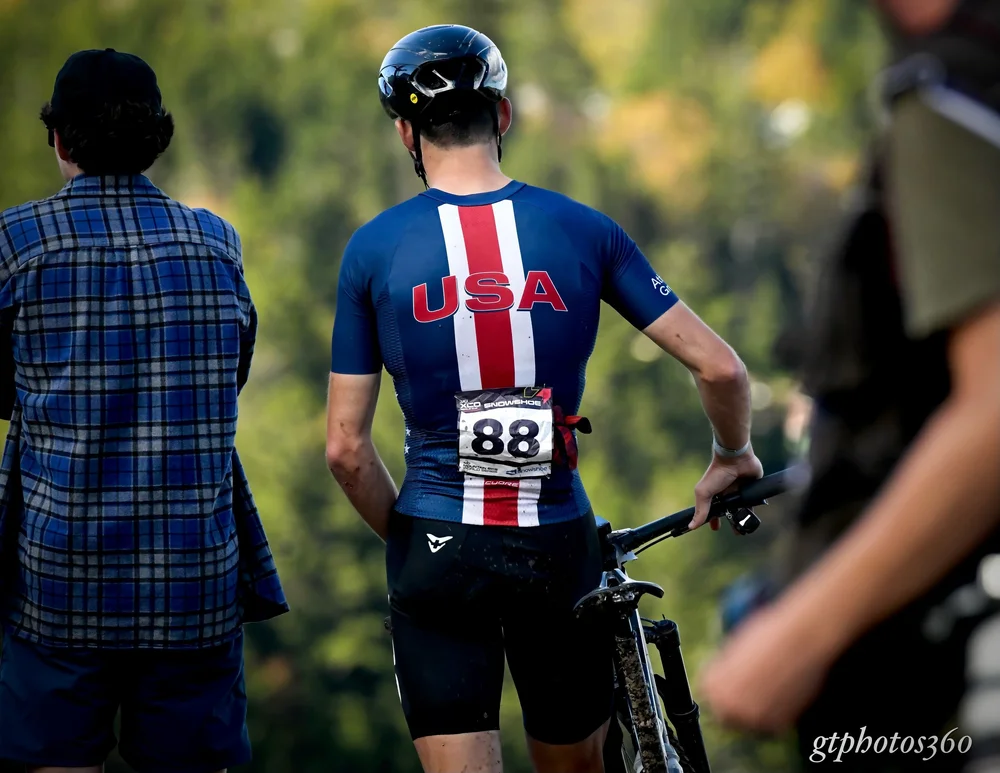
Endurance Coaching
Preparing for an endurance event or competitive season? By working with a coach, your training plan will be structured to meet the demands of your sport and fit into your lifestyle sustainably.
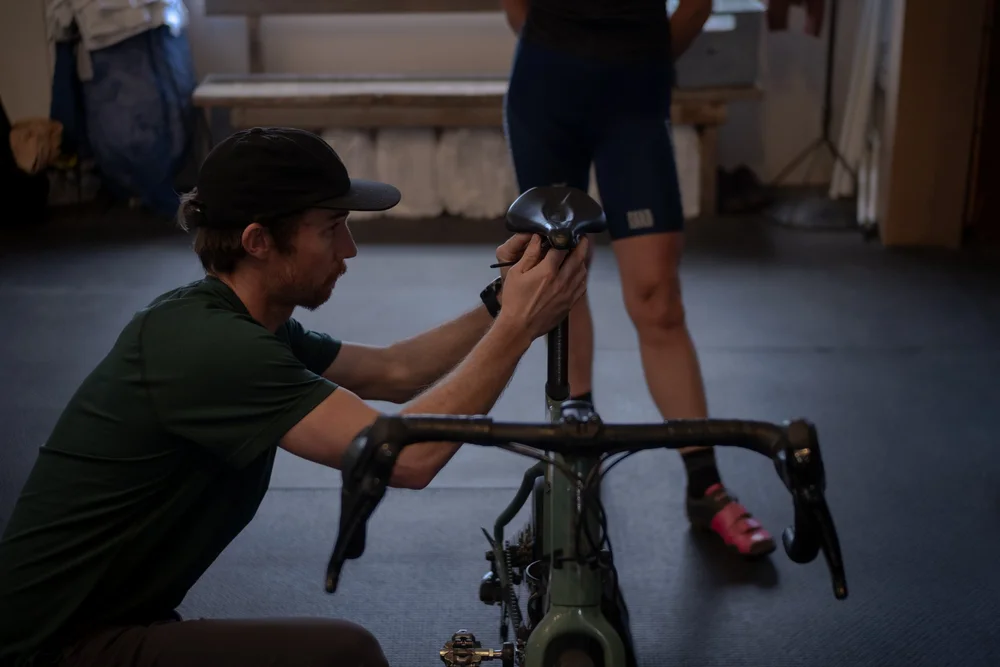
Bike Fitting
We'll take a full-depth evaluation of your riding position, analyzing your biomechanics with slow-motion video to measure joint angles and kinematics in motion. Before we evaluate you on the bike, we complete an in-depth movement & mobility screen to understand what kind of position your body can handle.
Resting Metabolic Rate (RMR)
Measure how many calories your body burns at rest, so nutrition plans start from your number — not an estimate.
Running Analysis & 1:1 Movement Training
Optimize your movement patterns for injury prevention and improved performance. This service is for runners, cyclists, skiers, or anyone who wants to move pain free.
Testing, coaching & consulting
Your data, turned into an actionable approach.
Looking to take a scientific approach to your training? After your test, we go through your results together so you understand your aerobic capacity, metabolic efficiency, and how your body performs at low, moderate, and high intensities. You walk away with actionable information to guide your training, whether you work with me as your coach or take it back to your current coach.
VO₂max & Uphill Running Speed
Across the athletes we’ve tested, VO₂max explains about 68% of the variance in maximal uphill speed, and running economy accounts for most of the rest. Knowing where you fit relative to our dataset identifies whether you need a bigger engine or should focus on running economy.
Lactate Thresholds
Your lactate curve shows exactly where LT1 and LT2 fall, dividing your intensity into moderate, heavy, and severe domains, so you can see how your body responds as intensity rises.
Find your limiters
Your estimated VLamax places you on a metabolic continuum. Lower values mean greater fat metabolism and lactate clearance, the ability to hold a higher fraction of VO₂max, and better durability over long efforts. Higher values mean more glycolytic, explosive power for short, high-intensity, or variable efforts.
Train in zones built from your thresholds
Your metabolic thresholds, LT1 and LT2, set your heart rate training zones, a research-supported methodology for enhanced training responsiveness.
| ZONE | DOMAIN | HR (bpm) |
|---|---|---|
| Zone 1 · Recovery | Moderate | Below 128 |
| Zone 2 · Endurance | Moderate | 128–145 |
| Zone 3 · Tempo | Heavy | 146–160 |
| Zone 4 · Threshold | Heavy | 161–170 |
| Zone 5 · VO₂max | Severe | Above 170 |
FatMax and carbohydrate oxidation rates
How many fat calories and grams of carbohydrates you burn per hour at each intensity, the basis for your fueling targets in training and on race day.
Know how to fuel in every zone
Your measured calorie burn sets a minimum hourly intake for long training days: in general, replace 20–30% of what you burn, aiming closer to 30% at higher intensities.
| ZONE | BURN (kcal/hr) | INTAKE (kcal/hr) 20–30% | CARBS (g/hr) at 30% |
|---|---|---|---|
| Zone 1 Active recovery |
733 |
147–220 | 55 |
| Zone 2 Endurance |
898 |
180–270 | 67 |
| Zone 3 Tempo |
1027 |
205–308 | 77 |
| Zone 4 Subthreshold |
1140 |
228–342 | 86 |
| Zone 5 VO₂max |
1269 |
254–381 | 95 |
Use these ranges as a starting point, then experiment. Longer or harder efforts may call for more, and gut training helps you tolerate higher intake. Heat, altitude, and hydration can also change your needs.
Retest and track progress
Follow-up tests show exactly how training changed your physiology. This client’s LT1 moved from about 870 to 1,530 vertical feet per hour, and LT2 from about 1,740 to 2,290, over three years.
Compare yourself to 300+ local athletes
Compare your VO₂max, thresholds, and economy rank in our local test database to better understand your strengths & weaknesses
How a test works
Book online
Pick a time and get prep instructions — what to eat, wear, and bring.
Test in the lab
A graded step test on your bike or treadmill, measuring gas exchange, lactate, and heart rate. [About X minutes.]
Leave with a plan
A written report with your zones, limiters, and training recommendations — reviewed with you in person.

Join the team.
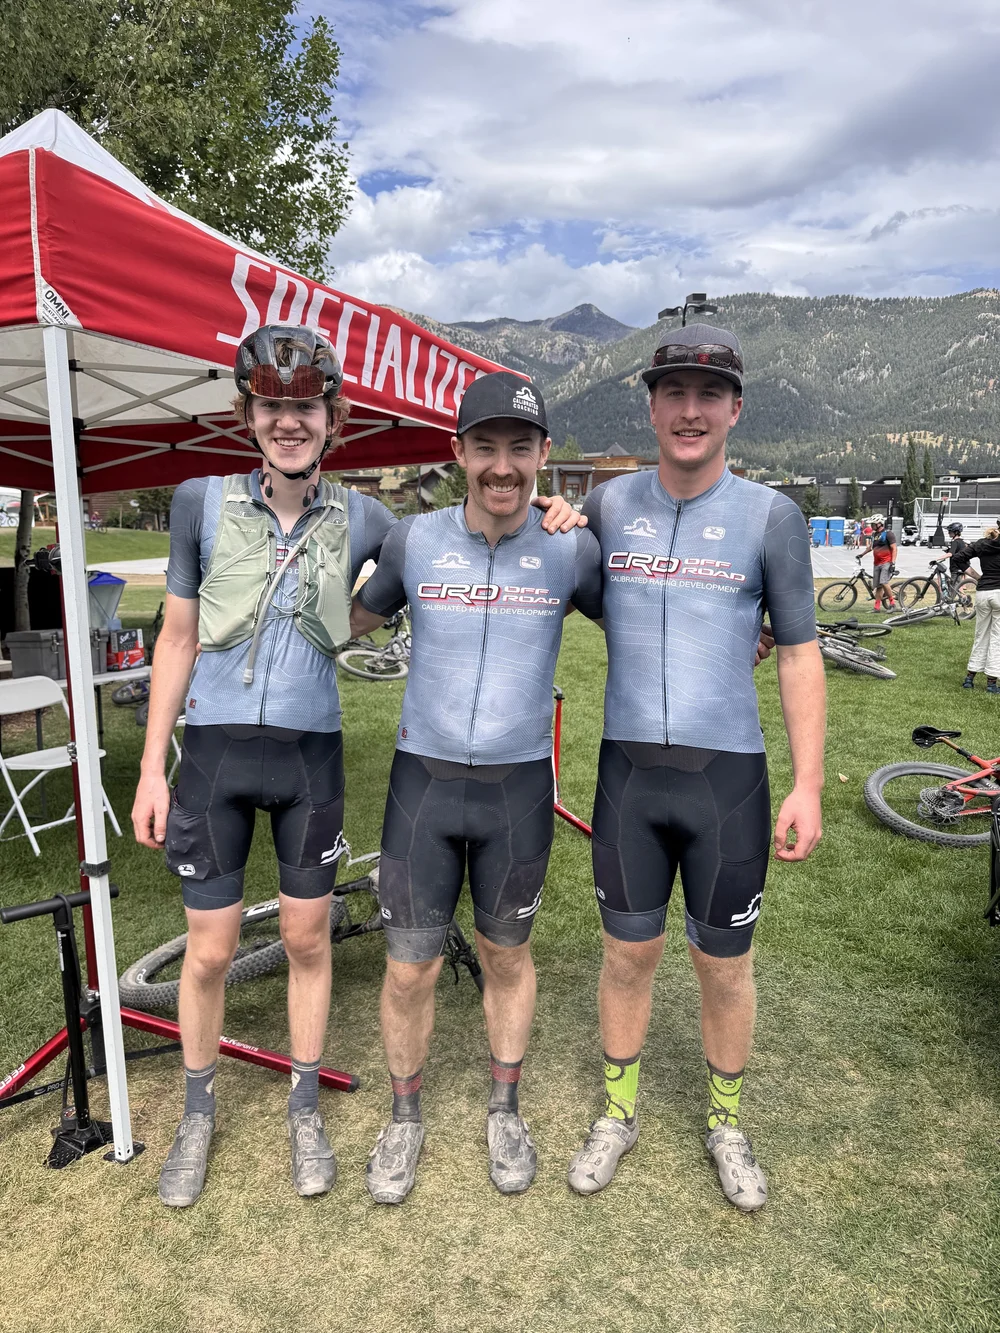
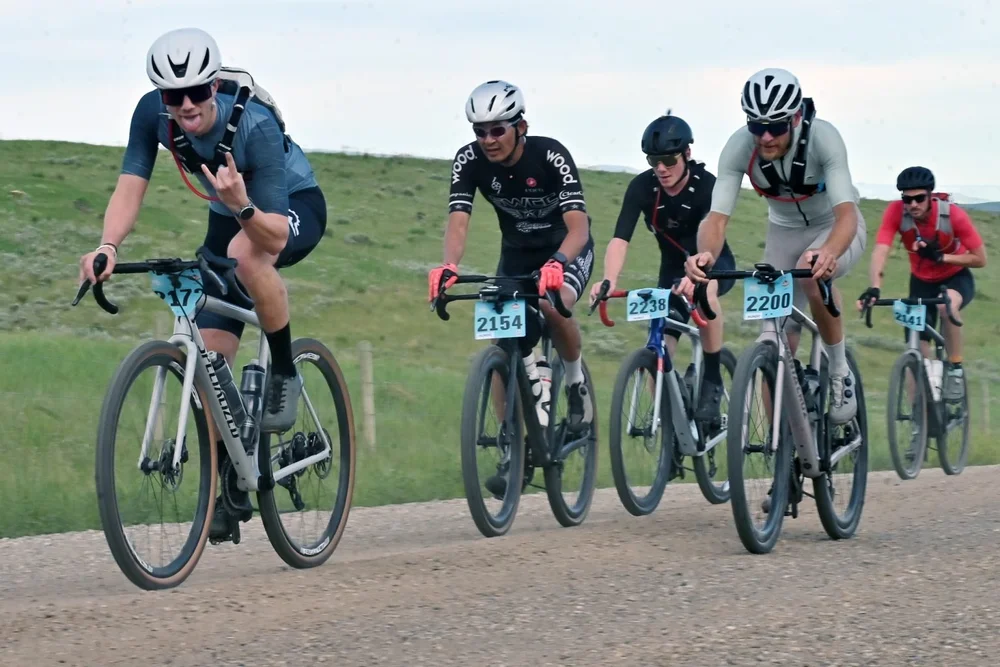
CRD is an off-road focused cycling team, racing mountain bike and gravel events. If you want to train with purpose and race alongside a crew that loves the dirt as much as you do, we’d love to hear from you.
Apply here